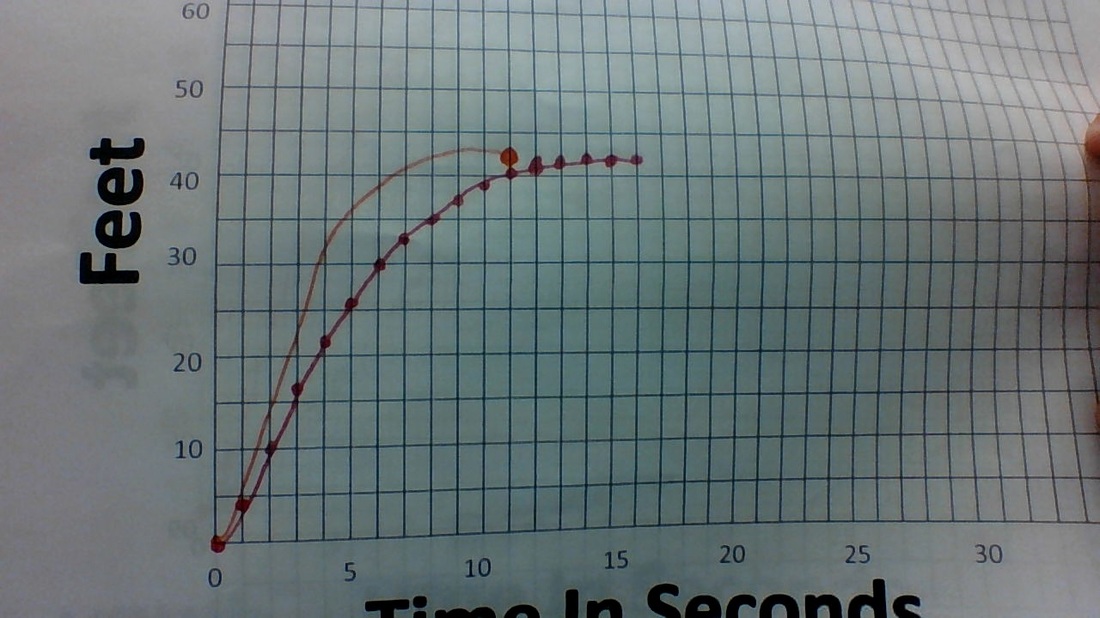
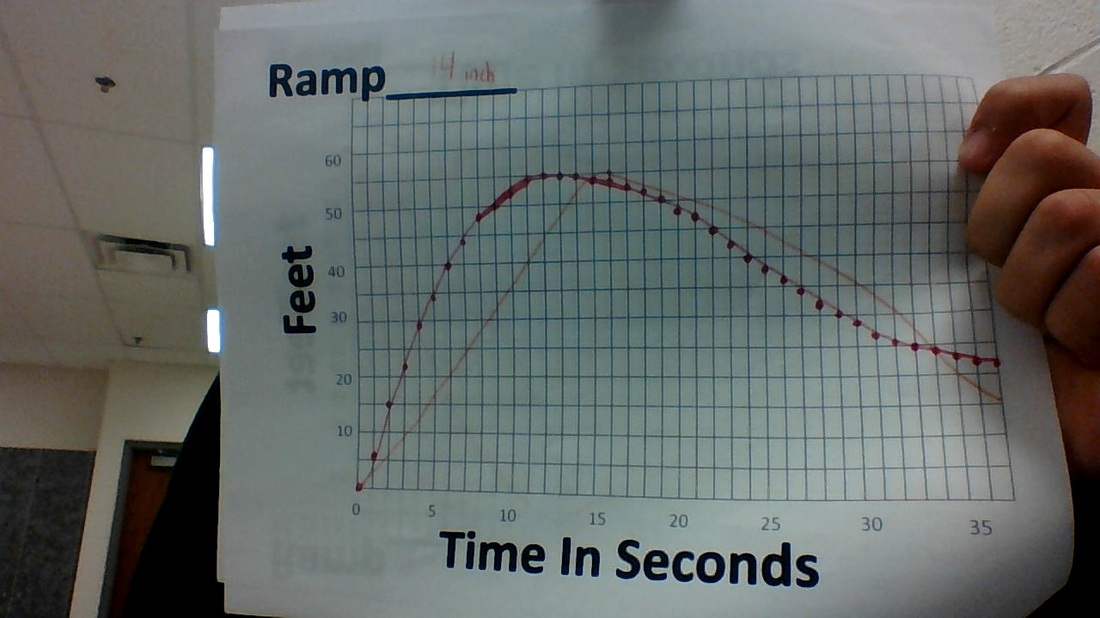
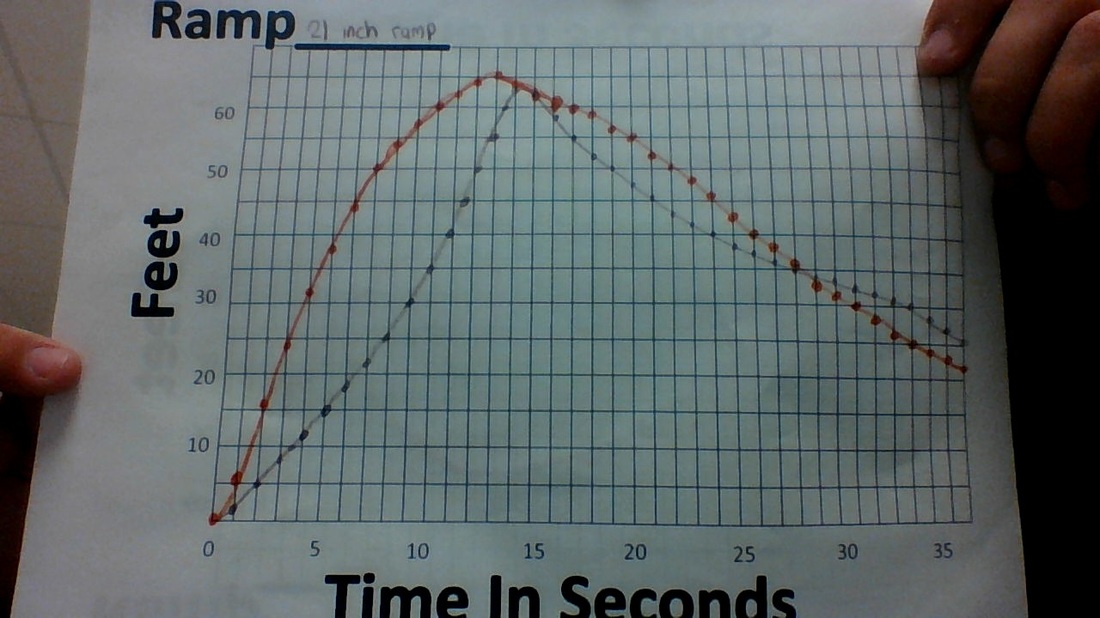
E. Images of the graph were posted earlier. The graphs are of a skateboard coming off different size ramps.
|
D. The graph rises the fastest right after it comes off the ramp. It drops the fastest after it picks up some speed coming back down.
C. They all start at 0. The first two have similar maximums and endings. The last one doesn't go as far up and then it ends there.
B. 21 inch ramp= (0, 65) U (65, 20)
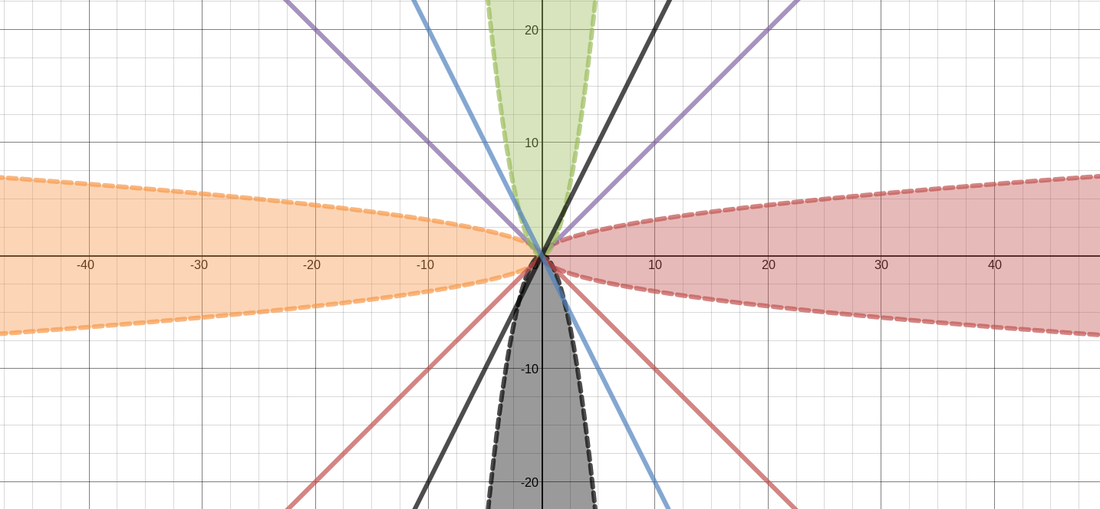
14 inch ramp= (0, 55) U (55, 22) 7 inch ramp= (0, 43) A. My prediction had a close stop and start to the actual graph. I wasn't too far off but I didn't think the skateboard would speed up as fast as it did, which means the slope
|
AuthorWrite something about yourself. No need to be fancy, just an overview. Archives
April 2015
Categories |
 RSS Feed
